In the SEO world, we spend a lot of time trying to climb the Google rankings; first trying to reach the first page on Google, then reaching above the fold, then fighting for the number one rank. And we do this for good reason — all the data we have suggests that those top search engine positions dominate the click through percentages.
We’ve discussed the Cornell Study on Google Click Distribution before, and now we’re going to take a look at another source of search engine click data — the infamous leaked AOL numbers from 2006.
The 2006 AOL Click Through Data
In 2006 AOL briefly put up data on over 35 million search queries — most importantly include which ranked position users clicked on — and promptly took that information back down, likely due to privacy concerns (or the fact that they weren’t supposed to be sharing that info with the world in the first place).
The internet being what it is, the raw data had already been downloaded and reposted all over the web. When you look around researching Google click distributions, trying to find out how many people click on the number 1 result vs the number 2 or number 10, the answers you’ll find most often are referring to this AOL data.
We’ll get into some analysis of how accurate that is in a moment, but first the numbers.
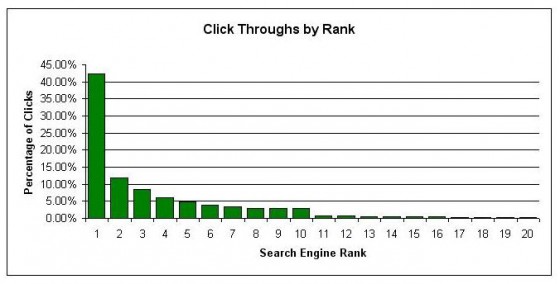
 The AOL data shows that 42.3% of users clicked on the number 1 search result — the organic result listed first in the search list. The number 2 rank received only 11.92% of the clicks, which fell to 8.44% for number 3.
By the time you reach the bottom of the first page of search results, we’re only seeing 2.97% click throughs on result number 10. And moving from the first page to the second page? The number 11 result yielded only 0.66% of clicks.
AOL is Not Google: Take this data with a grain of salt
It’s worth noting that even though Google was powering AOL’s search at the time, this is data based on AOL searches, not Google searches — and they present their search results a bit differently than Google does. Additionally, this data is now over 5 years old.
There is no doubt that this remains the single most comprehensive data source on search engine click distribution — over 35 million search queries from over 500,000 users over the course of several months — this is a phenomenal data set. And that’s probably why it’s so widely quoted even today.
But there are a couple of reasons why Google results are likely a bit different — and why we saw slightly different results in the Cornell study.
Google distribution is probably more skewed to the top
Google’s organic click distribution likely favors the very top results even more than this AOL data suggests. The reason has to do with the additional results that Google squishes in with your normal search results. This can include:
- Ads
- Image results
- Video results
- Shopping feed results
- Social results
The effect of all these different media streams being packed into the search results is that Google has far, far fewer actual organic web page search results above the fold than ever before. At time you’re lucky to see even two results without scrolling down.
This is going to force more clicks on those top few results, and fewer clicks on anything that users have to scroll down to find. This is exaserbated further by the increase in mobile search — where users see even fewer organic results above the fold.
And in fact, this is just what we saw in the Cornell study — showing the number 1 Google result gathering 56.36% of click throughs, rather than AOL’s 42.3%.
So while the ’06 AOL numbers are useful and fascinating data, the Cornell study is probably providing results that are a bit closer to reality when it comes to Google. And since that Cornell study, we are seeing even fewer above the fold organic search results, which means the percentage of clicks on those very top ranked results are likely only going to go up.


